|
To assess student learning during the inquiry, the student participants were surveyed twice, once at the beginning and again at the end. 23 students were involved in the survey, but due to unusually high student absence towards the end of the inquiry, only 13 completed both Survey 1 and Survey 2. 20 students completed Survey 1 and 16 students completed Survey 2. The survey used was the School Library Impact Measure (SLIM) (Todd, Kuhlthau & Heinstrom, 2005). Below is a summary and analysis of the student responses to the surveys.
Question 1
Take some time to think about the 'How we organise ourselves' inquiry. Write down everything you know about it.
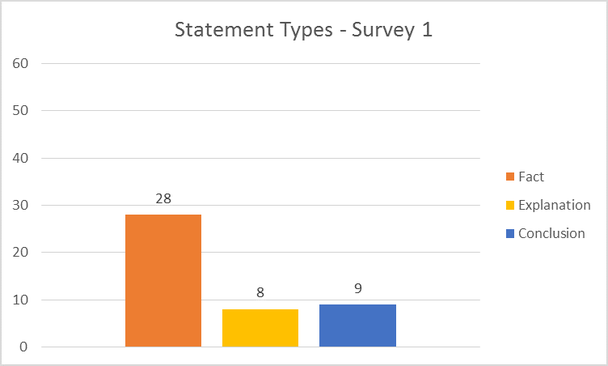
Graph 1: Results of Student Survey 1 - Q1*
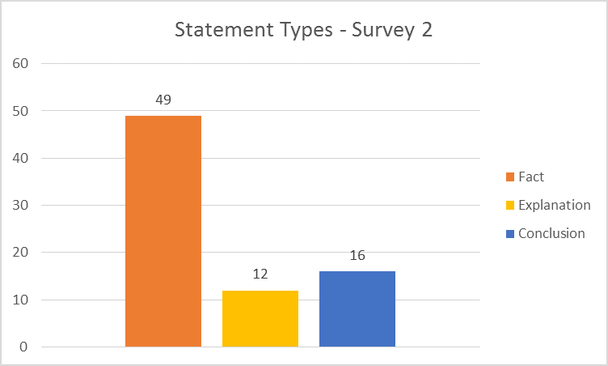
Graph 2: Results of Student Survey 2 - Q1*
*Only responses of students who completed both surveys are included in Graph 1 and Graph 2.
There was an increase in both the quantity of responses given in Survey 2, and the complexity of the responses, as indicated by the greater number of both explanation and conclusion statements. Such an increase suggests the "development of intellectual quality reflected in deeper knowledge and deeper understandings (SLIM Appendix B)". The Year 5 cohort are experienced at explicitly reflecting on their understanding of the central idea at the conclusion of an inquiry. This may have contributed to the phrasing of responses as either explanation or conclusion statements. For example Student 5 wrote "Natural disasters, such as Cyclone Tracy have a significant impact on a community." Student 8 concluded that, "A person or a group of people can do something to change/impact a community," and went on to explain, "When the Overland Telegraph Line was connected, Australia was able to communicate with the rest of the world more quickly and it made a big difference to many people's lives."
What was surprising was the significant increase in the number of fact statements, but this can be explained because some students used the facts to illustrate both explanation and conclusion statements. For example Student 6 wrote, "Many significant events have occurred that changed Australia to what it is today such as, The First Fleet arriving, Crossing the Blue Mountains, bringing Merino sheep, the Gold Rush, the Overland Telegraph Line, the Freedom Ride, Federation and women voting." Several students listed numerous examples of significant events in Australian history, which were classified as fact statements, even though they weren't phrased as full statements. This decision was made because unfortunately the students completing the survey were not given clear instructions and encouragement to detail their prior knowledge in full sentences, as per the administration guidelines for the SLIM survey. Question 2
How interested are you in this inquiry?
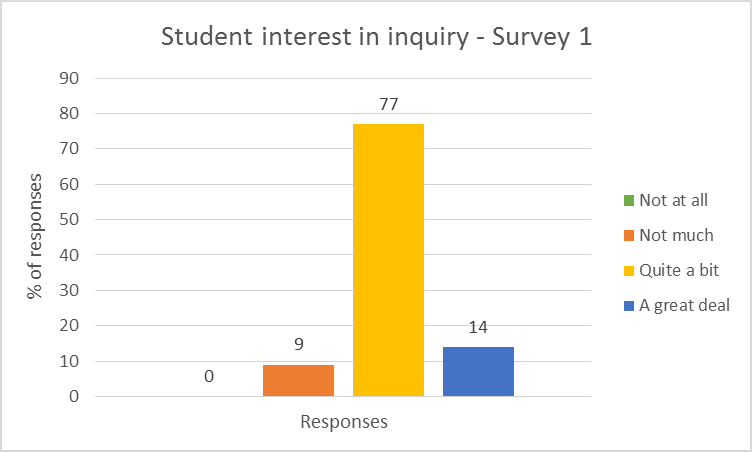
Graph 3: Results of Student Survey 1 - Q2*
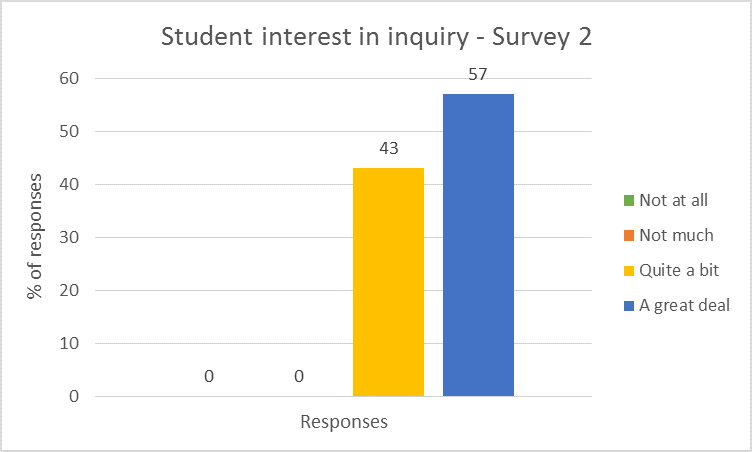
Graph 4: Results of Student Survey 2 - Q2*
*All student participant results are included in Graph 3 and Graph 4, represented as a percentage for fair comparison.
This survey was conducted after the first tuning in lesson of the inquiry, which had a goal of piquing student interest and sparking wondering. The results indicate that overall student interest in the inquiry was high and the tuning in lesson was a success. The lesson was teacher directed, but had a lot of scope for open ended thinking and student discussion. The students viewed an animated graph that illustrated the growth of Australia’s population over time: Australian Bureau of Statistics Animated Historical Population Chart. Students were invited to speculate about what may have caused certain growth spurts and explain the patterns of population growth in the different states and territories.
They then viewed a series of 21 Australian maps, which illustrated how the state and territory boundaries have changed over time, starting with a map showing traditional Aboriginal and Torres Strait Islander lands. There was great wonderment and amusement at the changes. One common comment was, "I didn't know that Western Australia used to be 'Swan River Colony'," and students asked "Why was the ACT called FCT?" and "What does FCT stand for?" Of course, for the purpose of the inquiry the teacher-librarian didn't know the answer to these questions. The class then revisited the animated graph of population growth and made connections between the two pieces of information. After a class discussion, students were invited to record their ideas on a padlet. They were asked to suggest events that may have affected the population change (see below).
Students were able to demonstrate their prior knowledge of significant events in Australian history. Kath Murdoch explains the importance of the tuning in phase of an inquiry when students can "make ‘visible’ their current thinking about the subject/question." I think this was an extremely effective learning experiences in the tuning in phase of an inquiry as it provoked student thinking and provided a stimulus for establishing prior knowledge. The lesson sparked student interest and introduced the conceptual idea that change occurs for a reason, without explicitly ‘teaching’ about any particular event. Even better, it generated student questions.
After using the SLIM survey to categorise student statements, my awareness of the type of responses given on Padlet was heightened. Interestingly, I observed that a large proportion of the posts on Padlet were explanation statements, which is significantly different to most responses given to Question 1, Survey 1. I speculate this may be because of two reasons. First, because the question students were asked was more specific and secondly because Padlet is a public forum students may have invested more effort into their responses. The data supports the effectiveness of the lesson with regard to kindling student interest and of steady or increased interest throughout the inquiry. Of the 13 students that completed both surveys, 46% gave a response in Survey 2 that moved up the scale, the majority from 'Quite a bit' to 'A great deal'. 3% of students had indicated ‘A great deal’ on Survey 1 and their response remained static, as did the responses of 31% who had initially indicated ‘Quite a bit’. However it should be noted that one of the students who selected 'Not much' in Survey 1, did not complete Survey 2. It would have been interesting to have seen the Survey 2 response of this student. Question 3
How much do you know about the 'How we organise ourselves' inquiry?
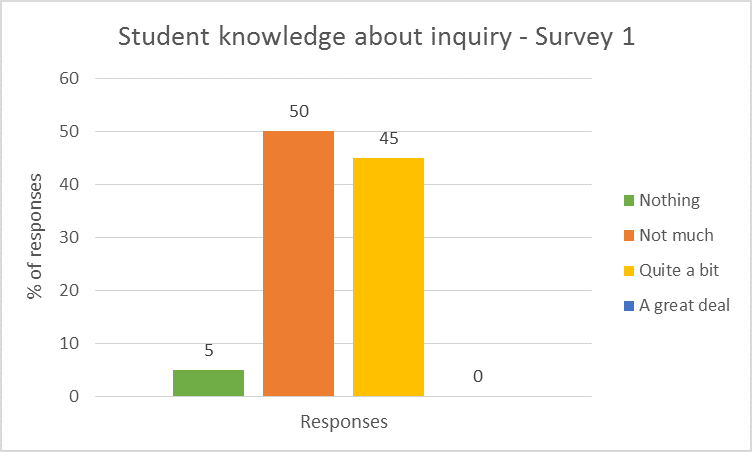
Graph 5: Results of Student Survey 1 - Q3*
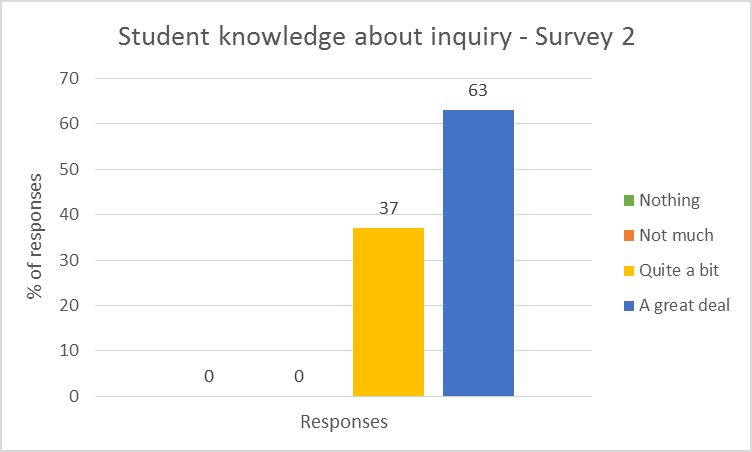
Graph 6: Results of Student Survey 2 - Q3*
*All student participant results are included in Graph 5 and Graph 6, represented as a percentage for fair comparison.
The majority of students (55%) who responded in Survey 1 indicated their prior knowledge of the inquiry was limited. This was a surprise because the Australian Curriculum Year 4 Humanities and Social Sciences, which is embedded in student inquiries, provides a knowledge platform on which to build. As such, students can usually make connections between prior inquiries. In this instance students should have been able to drawn on an understanding of European settlement of Australia. One quarter of the Year 5 cohort is new to the school in 2015, but even this shouldn’t be a factor - or what’s the point of a national curriculum? Or, this researcher could be analysing through a glass half empty lens, because 45% of students indicated they knew 'Quite a bit'!
The Survey 1 results were a surprise, but they weren’t disheartening for two reasons. One, because there's no point doing an inquiry if the students are equipped with the knowledge already, and two, because as the children speculated about reasons for the population change, they actually demonstrated prior knowledge. It is possible the children underestimated how much they knew from the outset, or it was the 45% in-the-know that dominated the class discussion! Another explanation is the students could have based their judgement purely on their lack of knowledge about how the Australian state and territory borders changed over time, as this was the only lesson the students had experienced at that stage of the inquiry. What was pleasing was the shift in responses between surveys. All but one of the children, who completed both surveys, indicated their level of knowledge had increased by the end of the inquiry – phew! One child assessed that they had ‘Quite a bit’ of knowledge at the beginning and the end of the inquiry. It would have been interesting to interrogate this response further to determine if the child considered any new knowledge had been gained during the inquiry. Table 1 (below) shows the extent of the self-assessed improvement in knowledge about the inquiry topic, with 100% of respondents judging their knowledge was greater than ‘Quite a bit’. 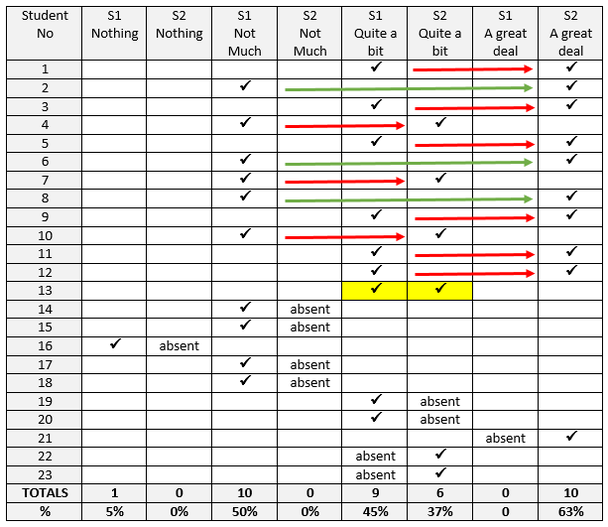
Table 1: Summary of student responses for Surveys 1 and 2 - Q3
Question 4
When you do research, what do you generally find easy to do?
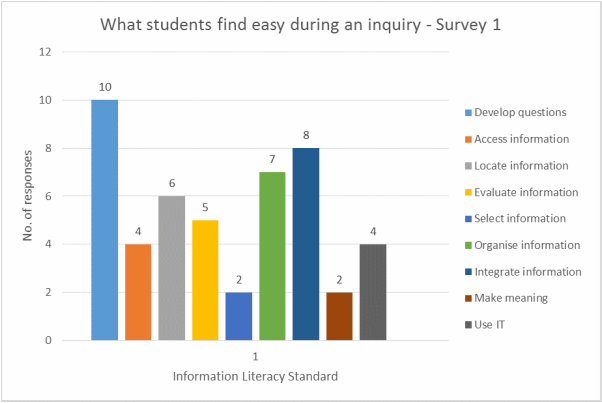 Graph 7: Results of Student Survey 1 - Q4* Graph 7: Results of Student Survey 1 - Q4*
*Results of all students who completed Survey 1 are included in Graph 7
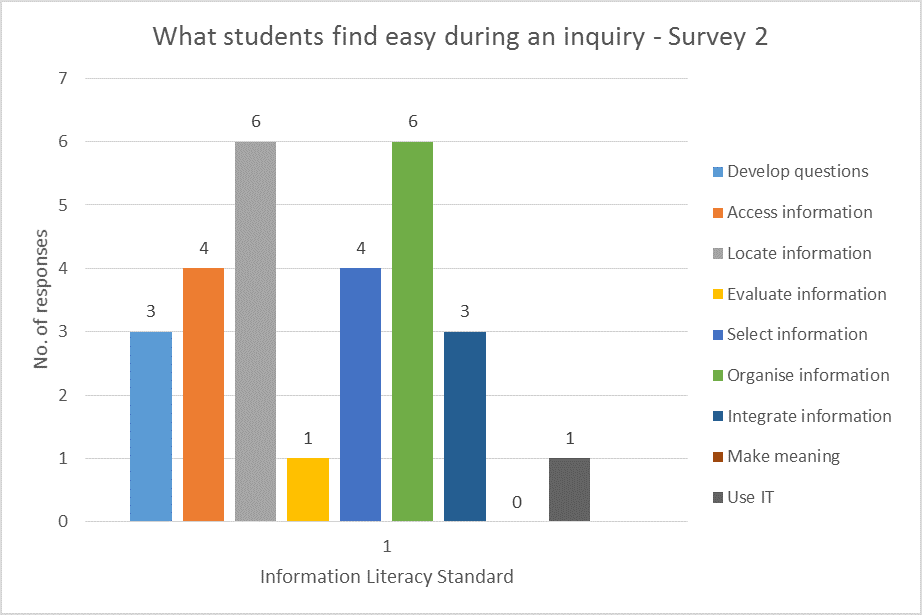
Graph 8: Results of Student Survey 2 - Q4*
*Results of all students who completed Survey 2 are included in Graph 8
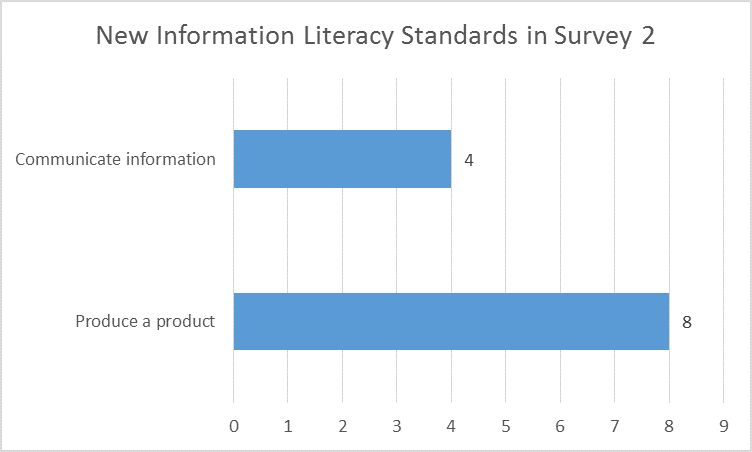
Graph 9: Results of Student Survey 2 - Q4*
*Results of all students who completed Survey 2 are included in Graph 9
Student self-evaluation conducted at the beginning of an inquiry, such as in Survey 1 is useful formative assessment. Reading between the lines, and identifying the standards that did not rate a mention is possibly more informative than the responses given. For example the Year 5 students often pose questions as an explicit part of an inquiry in the PYP, so it is not surprising this skill rated highly, but the fact that no student referred to practices that honour intellectual property rights may indicate a need to review this area. Some of the other standards not listed include: distinguishing between fact, point of view and opinion; identifying misleading information; and critical thinking and problem solving, all of which are important skills when undertaking research, but students may not have thought to mention them because they assumed reading comprehension skills in everyday use.
Overall students indicated that 53% of the Information Literacy Standards used in the SLIM survey were ‘easy’. Given that students were able to provide a free response to this question, it is interesting that there is a high correlation between the student responses and the SLIM standards, which are based on the AASL Information Literacy Standards. It would be interesting to provide the standards and invite students to rate themselves on each. There were fewer students who completed Survey 2, so a direct comparison of the number of responses for each information literacy standard is not necessarily an indicative measure, but an analysis based on the trends is possible. It is evident that the results of both Survey 1 and Survey 2 reflect the stage of the inquiry. In Survey 1, questioning rated most highly, but dropped significantly in Survey 2 because students had a greater focus on locating and organising information in order to answer the questions. As illustrated on Graph 9, two additional standards were included in student responses in Survey 2, 'produce an appropriate product' and communicate information', both of which also reflect the stage of the inquiry. Producing a product was the standard mentioned the most in Survey 2, which in fact, by necessity, encompasses many of the other information literacy standards. As a summative assessment task, the product that students were required to produce to communicate their understanding of the central idea was four diary entries about a common event, each portraying a different perspective. In the example shown below a student who chose the building of The Overland Telegraph as a significant event in Australian history, wrote about the event from the perspective of John McDougall Stuart, Charles Todd, a citizen in Adelaide and the S.A. Government. To assume these personas and write about the impact of the connecting of Overland Telegraph required detailed understanding about the event. The fact that such a high proportion of students (62%) mentioned this was an easy task indicates they considered they had conducted successful research. 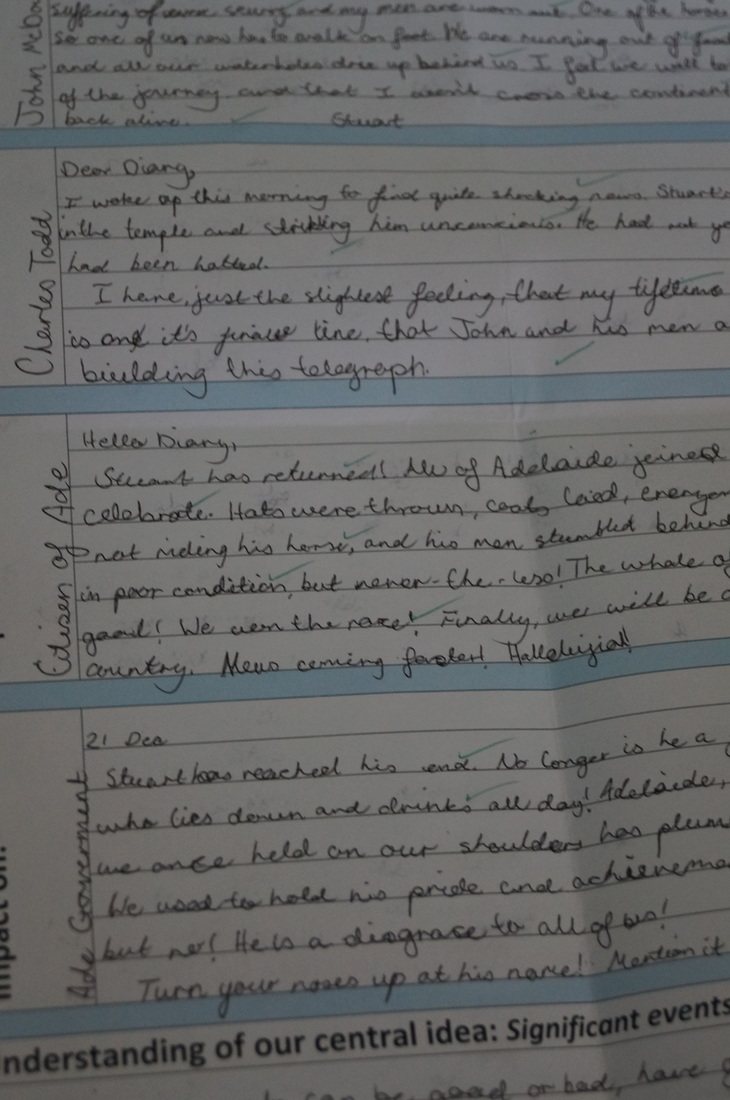
Student example of diary entries from four perspectives Photo: Louise Cullen
Several students indicated they found the diary writing task easy because they only had to write a paragraph to sum up each perspective. One student stated, "I found presenting to the class was probably the easiest because I knew so much about the topic that I was confident." This was one of the four similar comments that resulted in the addition of the communicating information standard in Survey 2.
Question 5
When you do research, what do you generally find difficult to do?
In Survey 1, the most common Information Literacy Standards identified as difficult included:
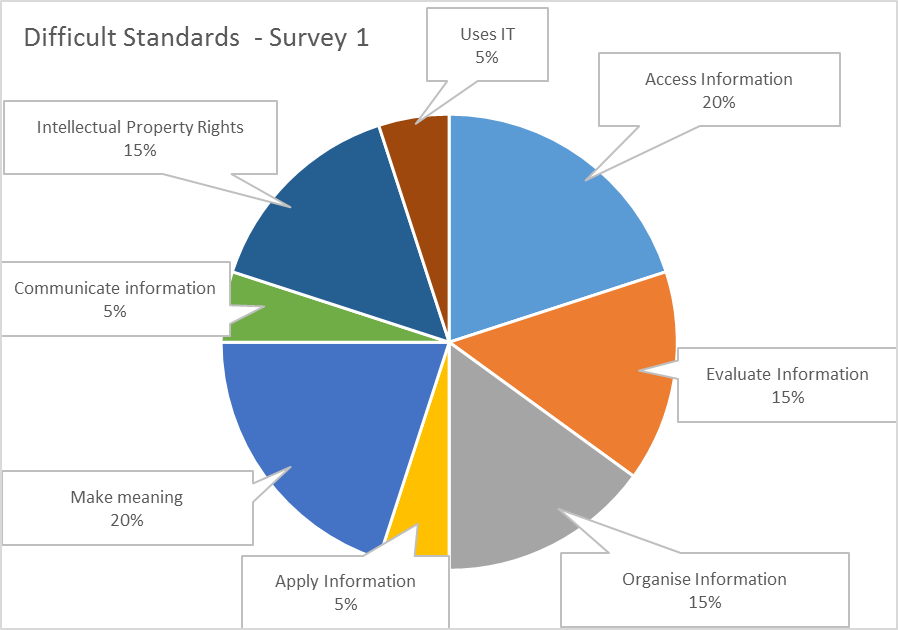
Graph 10: Results of Student Survey 1 - Q5*
*Results of all students who completed Survey 1 are included in Graph 10
A representative selection of Survey 1 responses:
In Survey 2, the most common Information Literacy Standards identified as difficult included:
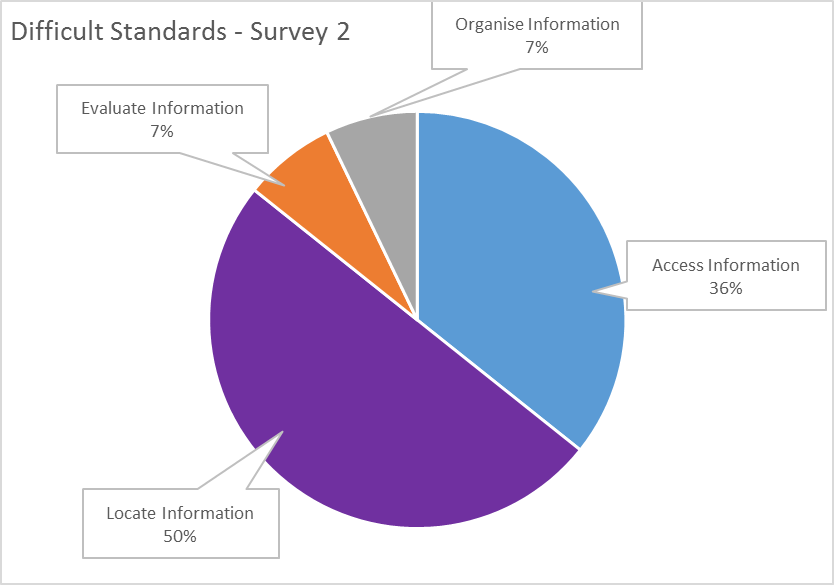
It is interesting to note that although locating information was the most commonly identified 'difficult' standard in Question 5, accounting for 50% of the responses, it was by contrast identified as an 'easy' standard by 21% of students responding to Question 4, Survey 2. Many students relayed the difficulty they had locating information about different perspectives on a topic. The degree of difficulty locating such information depended on which significant event students had selected, which may be one factor to explain the contrasting results. Another factor may be differing student skill levels when locating information.
Analysing the overall trends of what students identified as difficult, is useful to inform teaching requirements to equip students with the skills they require to conduct an independent inquiry. It may also be beneficial to compare individual student responses across Question 4 - What is easy? and Question 5 - What is difficult?, particularly those that were inverse, such as the two illustrated below.
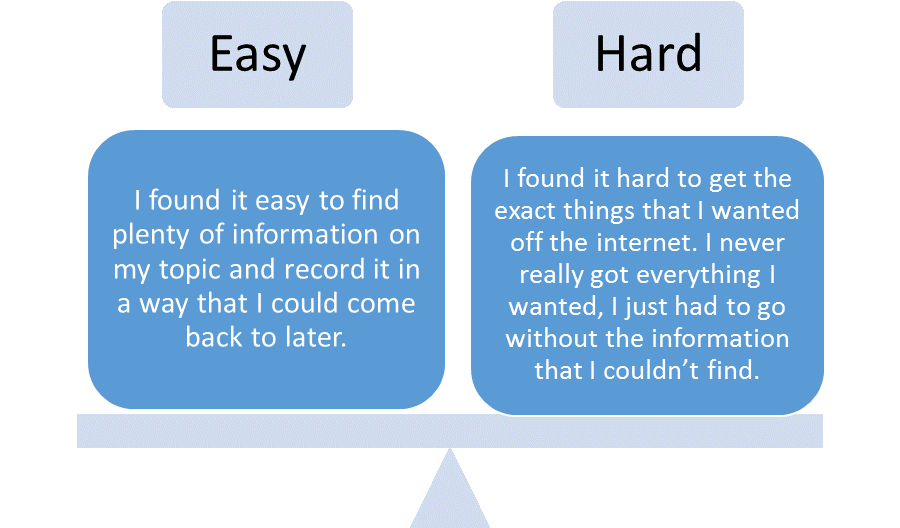
Student 8 responses - Q4 & 5, Survey 2
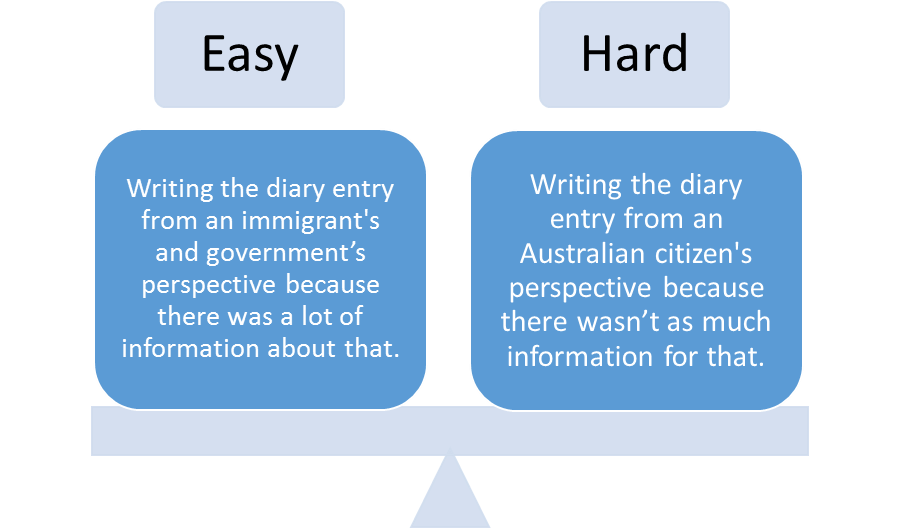
Student 12 responses - Q4 & 5, Survey 2
Question 6
What did you learn in doing this research project?
Year 5 students misinterpreted the intent of this question. Every student wrote about the content-related knowledge they gained during the research process, rather than focusing on the information skills they learned. One student did acknowledge improved search skills using Google. A summary of the breadth of content-based knowledge is depicted in the word cloud below.
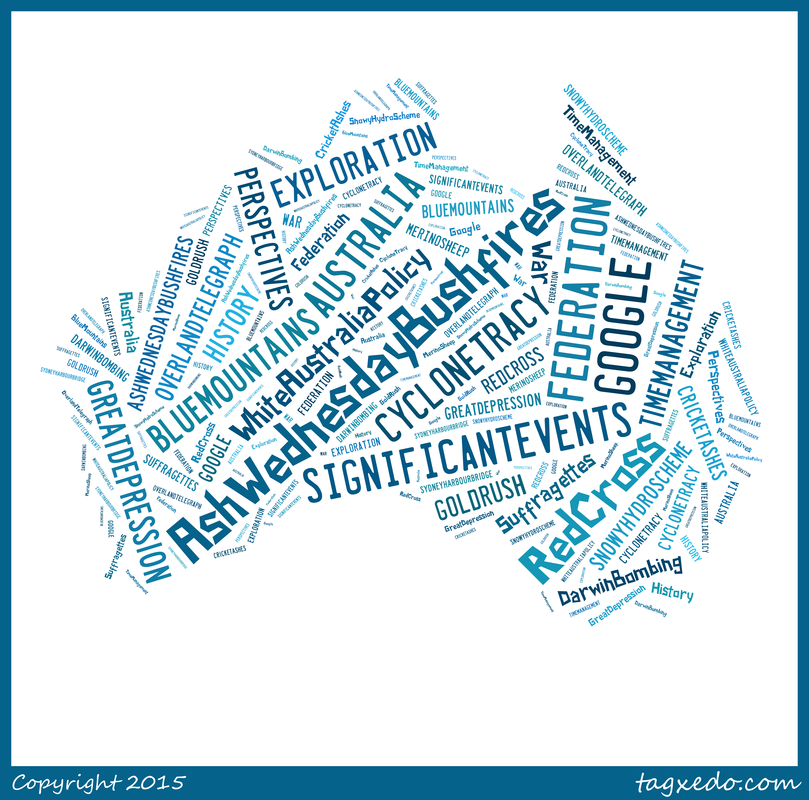
Student responses to Question 6, Survey 2. Image: Louise Cullen produced using Tagxedo
1 Comment
|